Fudge Brownie Protein Bar vs Cookies & Cream Protein Bar
David Fudge Brownie Protein Bar gives more protein per calorie than Kirkland Signature Cookies & Cream Protein Bar.
David Fudge Brownie Protein Bar: 28 g protein, 150 calories, 0 g sugar. Kirkland Signature Cookies & Cream Protein Bar: 22 g protein, 170 calories, 2 g sugar, per serving. David Fudge Brownie Protein Bar is better on protein per 100 cal, protein, calories, sugar, sodium; Kirkland Signature Cookies & Cream Protein Bar is better on fiber.
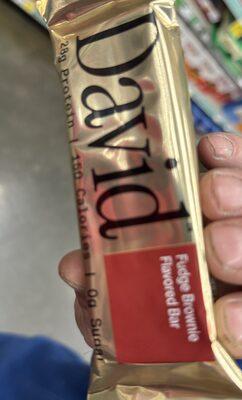
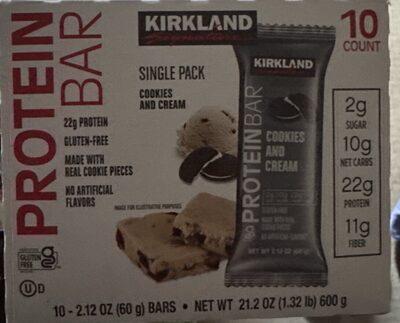
Per serving, side by side
| Fudge Brownie Protein Bar | Nutrient | Cookies & Cream Protein Bar |
|---|---|---|
| 18.7 g | Protein per 100 cal | 12.9 g |
| 28 g | Protein | 22 g |
| 150 | Calories | 170 |
| 0 g | Sugar | 2 g |
| 1 g | Fiber | 11 g |
| 150 mg | Sodium | 170 mg |
Bold marks the better value. Lower is better for calories, sugar and sodium.
Fudge Brownie Protein Bar: diets
- Gluten-freeon label
Cookies & Cream Protein Bar: diets
- Gluten-freeon label
Frequently asked questions
Which has more protein, David Fudge Brownie Protein Bar or Kirkland Signature Cookies & Cream Protein Bar?
David Fudge Brownie Protein Bar has more protein per serving: 28 g versus 22 g. Per 100 calories, David Fudge Brownie Protein Bar has 18.7 g and Kirkland Signature Cookies & Cream Protein Bar has 12.9 g.
Which has less sugar, David Fudge Brownie Protein Bar or Kirkland Signature Cookies & Cream Protein Bar?
David Fudge Brownie Protein Bar has less sugar: 0 g versus 2 g per serving.
Which has fewer calories, David Fudge Brownie Protein Bar or Kirkland Signature Cookies & Cream Protein Bar?
David Fudge Brownie Protein Bar has fewer calories: 150 versus 170 per serving. Serving sizes differ, so compare protein per 100 calories too.