How to Choose a Healthy Protein Snack: A 6-Step Label Check
By Editorial Team. Updated . 9 min read.
To choose a healthy protein snack, read the Nutrition Facts panel and check six things per serving: calories under 200, protein of 10 g or more, sugar of 5 g or less, fiber of 3 g or more, sodium under 400 mg, and a complete protein listed early in a short ingredient list.
Key takeaways
- The front of the pack is marketing. The Nutrition Facts panel and ingredient list are the evidence.
- We rank every snack by protein per 100 calories: protein (g) ÷ calories × 100, using the label serving.
- Our five screening lines are the same ones shown on every product page's Snack Facts label.
- Published thresholds disagree, and some popular rules of thumb have never been tested. We explain ours and why below.
The 6-step protein snack label check
Step 1: Start with serving size and calories (under 200)
Every number on the label applies to one serving, and the FDA notes that a serving size is a standardized amount, not a recommendation (opens in a new tab). Check servings per package first. A bag of protein puffs that lists a 1-ounce serving but holds three ounces triples everything.
Under 200 calories keeps a snack a snack. Bars with 280 calories or more are closer to a small meal; Cleveland Clinic (opens in a new tab) treats meal-replacement bars as a separate category from snack bars.
Step 2: At least 10 g of protein, then compare protein per 100 calories
Ten grams is 20% of the 50 g protein Daily Value (opens in a new tab). That is the level the FDA uses for "high in protein" claims (more on that below). Then work out protein per 100 calories: protein grams ÷ calories × 100. This is the number we sort by, because it rewards protein rather than size. A snack that meets both of our lines (10 g or more in under 200 calories) is already above 5 g per 100 calories; the strongest packaged picks reach 10 g or more. Full explanation: protein per 100 calories and how much protein a snack should have.
Step 3: Sugar of 5 g or less
Look at the indented line "Includes Xg Added Sugars." The FDA sets a 50 g Daily Value for added sugars (opens in a new tab) and none for total sugars. Five grams is 10% of that Daily Value. The 2025–2030 Dietary Guidelines advise no more than 10 g of added sugar per meal, according to the AAFP summary (opens in a new tab), so a snack should come in well below that.
Our site-wide screen uses total sugars, not added sugars, because many product records list only total sugars. Total is the stricter test: a snack that passes on total sugars also passes on added sugars. Fruit- and milk-based snacks can fail it while having little added sugar, so read both lines.
Step 4: Fiber of 3 g or more
Fiber adds fullness. Three grams is just over 10% of the 28 g Daily Value, the bottom of the FDA's "good source" range. Very high fiber in a small bar usually comes from added fibers; check the ingredient list to see where it comes from, especially if added fibers give you gas.
Step 5: Sodium under 400 mg
Under 400 mg is below about 17% of the 2,300 mg Daily Value, short of the FDA's 20% "high" mark. This step matters most for jerky, meat sticks, cheese crisps and protein chips (see the sodium section below).
Step 6: A complete protein, listed early, in a short ingredient list
Ingredients are listed by weight, so the protein source should be near the top. Whey, milk protein, egg white, soy, meat, fish, or a pea-and-rice blend are good signs. Syrups among the first three ingredients, or collagen as the lead protein, are not. A short list is not automatically healthier, but a long list of isolates, sweeteners and gums usually signals a highly processed product.
| Step | What we check (per serving) | Why this line |
|---|---|---|
| 1. Calories | Under 200 | Snack-sized; about 10% of a 2,000-calorie reference diet |
| 2. Protein | 10 g or more; sorted by protein per 100 kcal | 20% of the 50 g Daily Value, the FDA "high" level |
| 3. Sugar | 5 g or less (total sugars) | 10% of the added-sugar Daily Value; total is the stricter test |
| 4. Fiber | 3 g or more | Just over 10% of the 28 g Daily Value |
| 5. Sodium | Under 400 mg | Below the 20% "high" level of the 2,300 mg Daily Value |
| 6. Ingredients | Complete protein listed early | Protein quality, not just grams |
Why protein snack thresholds disagree
Search for label advice and you will find protein lines anywhere from 4 g to 20 g per serving. A sponsored snacking blog suggests at least 4 g. Some dietitian roundups use 8 to 10 g. A bar brand's guide asks for 10 g, then 15 to 20 g for muscle-building goals. None of them is wrong in itself; they answer different questions:
- Snack or meal? A 120-calorie snack and a 350-calorie meal-replacement bar should not be held to the same protein number.
- Whose goal? An athlete chasing a post-workout dose, someone eating for weight control, and a parent packing a lunchbox need different amounts.
- Who wrote it? Brand guides often set lines that their own products clear.
We chose lines that apply to everyday snacks and that tie back to FDA Daily Values, so anyone can check them against a label. They are screening lines, not health rules. A snack that misses one is not "bad"; it just does something other than what we screen for.
The same caution applies to shortcuts. One common rule says a snack is good if protein plus fiber outweighs sugar; another wants a 2:1 protein-to-sugar ratio. They are easy to remember, but we found no study that validates either one, so we don't use them in our rankings and we don't present them as science.
What "good source" and "high protein" mean on the label
Front-of-pack protein claims are regulated. Under 21 CFR 101.54 (opens in a new tab), a food can say "high," "rich in" or "excellent source of" a nutrient when it provides at least 20% of the Daily Value per reference amount customarily consumed, and "good source," "contains" or "provides" when it provides 10 to 19%.
For protein there is an extra step. When a protein claim is made, the label must show a %DV, and that %DV is based on protein adjusted for quality (PDCAAS) under 21 CFR 101.9(c)(7) (opens in a new tab). That is why a collagen-heavy bar can list plenty of protein grams yet still not qualify as "high protein." Without a claim, the protein %DV is optional, and most snacks leave it blank.
How to read the Nutrition Facts panel
The FDA's label guide (opens in a new tab) gives a simple rule for the %DV column: 5% DV or less is low, 20% DV or more is high. Aim low for saturated fat, sodium and added sugars, and high for fiber.
Total vs added sugar. Total sugars include sugar naturally in milk, fruit or dates. The "Includes" wording means added sugars are already counted inside total sugars, not on top of them.
Sugar alcohols. Erythritol, maltitol and similar sweeteners may appear under Total Carbohydrate. Listing them is voluntary unless the package makes a sugar claim, such as "1 g sugar" (21 CFR 101.9 (opens in a new tab)). They are not sugars on the label, so we don't count them toward our sugar line. Tolerance and blood-sugar effects vary by type; our low-sugar protein snacks guide covers them in full.
Protein sources ranked
Protein quality depends on which amino acids a protein supplies and how well you digest it. PDCAAS (Protein Digestibility Corrected Amino Acid Score) is the measure US labels use, capped at 1.0. DIAAS (Digestible Indispensable Amino Acid Score) is a newer method that measures digestion more precisely; a score of 75 or more counts as high quality and 100 or more as excellent. Either way, higher means more of the protein can be used to build and repair tissue. The table uses the DIAAS classes from a 2020 review of plant and animal proteins (opens in a new tab) by Herreman and colleagues.
| Protein source | Quality (DIAAS class) | Notes |
|---|---|---|
| Egg | Excellent (100 or more) | Common in short-ingredient bars |
| Casein (milk protein) | Excellent (100 or more) | The slower-digesting milk protein |
| Whey | High (75 or more) | Complete; the most common bar protein |
| Soy | High (75 or more) | Strongest single plant protein; average PDCAAS about 0.92 in a 2022 review of soy quality (opens in a new tab) |
| Pea | Below 75 (no quality claim) | Usually blended with rice to fill amino acid gaps |
| Rice | Below 75 (no quality claim) | Pairs well with pea |
| Gelatin and collagen | Below 75 (no quality claim) | Collagen lacks tryptophan and is an incomplete protein (opens in a new tab) |
Ingredients to limit
- Collagen or gelatin as the lead protein. The grams look good; the quality doesn't (see the table above).
- Syrups high on the list. Brown rice, tapioca, glucose or cane syrup among the first three ingredients means sugar is doing much of the work.
- Confectionery coatings. Chocolate-flavored coatings, often made with palm kernel oil, can add several grams of saturated fat. Check the %DV.
- Low-protein "protein crisps." Crisps made mostly of rice flour add crunch and calories, not much protein.
- Heavy sweetener blends. The 2025–2030 Dietary Guidelines advise limiting highly processed foods and nonnutritive sweeteners, per the AAFP summary (opens in a new tab).
Sodium check for jerky, meat sticks and chips
Meat snacks are among the most protein-dense packaged foods: in our analysis of 1,026 US Open Food Facts records for jerky and meat snacks, the median delivers 11.1 g of protein per 100 calories. Salt is the trade-off. The median serving carries about 400 mg of sodium, right at our 400 mg line, against a Daily Value of 2,300 mg (opens in a new tab).
- Under 400 mg per serving: passes our screen.
- 400 to 600 mg: fine now and then; go easier on salt for the rest of the day.
- Over 600 mg: a salty snack, however much protein it has.
Sweet marinades also add sugar, so check that line too. Compare products in jerky and meat snacks.
Whole-food vs packaged protein snacks
| Whole foods (plain yogurt, eggs, tuna, edamame) | Packaged (bars, jerky, chips) | |
|---|---|---|
| Protein density | Often high, especially lean dairy, eggs and fish | Wide range; most bars fall short of 10 g per 100 kcal |
| Added sugar | Usually none in plain versions | From none to a lot |
| Processing | Minimal | Often NOVA group 4 (ultra-processed) |
| Convenience | Often needs a fridge | Shelf-stable and portable |
Both have a place. Packaged snacks win on convenience; whole foods usually win on everything else. For bar-specific advice, see are protein bars healthy?.
Three bars, run through the checklist
Values per labeled serving, from Open Food Facts. Recipes change, so check the package you buy.
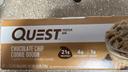
Quest Chocolate Chip Cookie Dough bar (60 g): 190 calories, 21 g protein, 11.1 g protein per 100 calories, 1 g sugar, 12 g fiber, 220 mg sodium. It clears all five lines. One caveat: a newer, larger formulation (about 250 calories and 25 g protein) is also on shelves, so check which one you have.
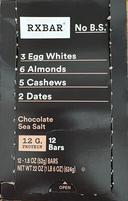
RXBAR Chocolate Sea Salt (52 g): 200 calories, 12 g protein, 6.0 g protein per 100 calories, 14 g total sugars, 190 mg sodium. It passes on protein and sodium, sits right on the calorie line (our test is under 200), and fails our total-sugar line. It has 0 g added sugar on the current US label; the sugar comes from dates.
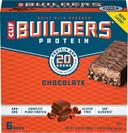
Clif Builders Chocolate (68 g): 280 calories, 20 g protein, 7.1 g protein per 100 calories, 17 g sugar, 213 mg sodium. Plenty of protein, but too many calories and too much sugar for an everyday snack. It fits better after a long workout.
How we rank snacks
This is the method behind every list on the site, including best protein snacks, vegan protein snacks, keto protein snacks, protein snacks for weight loss and low-sugar protein snacks.
1. One ranking metric: protein per 100 calories. We calculate protein (g) ÷ calories × 100 from the label serving, rounded to one decimal place, and sort by it. Higher means more protein for the calories.
2. Five screening lines, shown on every product's Snack Facts label. Per serving: 10 g protein or more, under 200 calories, 5 g sugar or less (total sugars), 3 g fiber or more, and under 400 mg sodium. A value that passes is highlighted, and a value missing from the label is shown as not listed rather than guessed. Landing pages apply their own filters on top: the weight-loss list requires 10 g protein or more and 200 calories or fewer; the low-sugar list requires 10 g protein or more and 5 g sugar or less; the keto list requires a keto label or 5 g or fewer net carbs (carbs minus fiber).
3. Data sources. Packaged snack values come from the product label as recorded in Open Food Facts (opens in a new tab), linked from each product page by barcode. Whole-food values come from USDA FoodData Central (opens in a new tab), cited by FoodData Central ID. Dataset statistics on this site come from the US Open Food Facts export.
4. Data cleaning. We reject records that cannot be right: any product listing more than 90 g of protein per 100 g, and any whose label calories don't match its macros within 20%, using 4 × protein + 4 × (carbs − fiber) + 2 × fiber + 9 × fat. Records with macros adding up to more than 105 g per 100 g, or more sugar than carbohydrate, are removed too. Where Open Food Facts has them, we also show NOVA processing group and Nutri-Score, but neither affects the ranking.
5. Diet labels. We tag a snack vegan or gluten-free only when the package or its Open Food Facts labels confirm it. We don't infer diet tags from ingredient lists. Our gluten-free protein snacks guide explains what those claims mean.
6. No ratings, no paid placement. We don't publish star ratings or review scores, and no brand can pay for a place or a better position. Rankings change only when label data changes.
Frequently asked questions
What should I look for in a healthy protein snack?
Read the Nutrition Facts panel, not the front of the pack. Our screen is at least 10 g of protein, under 200 calories, 5 g of sugar or less, 3 g of fiber or more and under 400 mg of sodium per serving. Then check that a complete protein appears early in the ingredient list.
What does "high protein" mean on a snack label?
Under FDA rules (21 CFR 101.54), "high" or "excellent source" means at least 20% of the Daily Value per reference serving, and "good source" means 10 to 19%. With a 50 g protein Daily Value, that is about 10 g and 5 g, after the protein is adjusted for quality using PDCAAS.
What ingredients should I avoid in protein bars?
Be cautious when collagen or gelatin is the main protein, when syrups appear among the first three ingredients, and when a chocolate-style coating pushes saturated fat up. Large amounts of sugar alcohols upset some stomachs. None of these is dangerous in itself, but each one makes a bar less useful as a protein snack.
Is collagen protein as good as whey?
Not as a protein source. Collagen lacks tryptophan, one of the essential amino acids, so it is an incomplete protein and adds little once a label corrects protein for quality. Whey is a complete protein rated high quality on the DIAAS scale. Collagen grams on a label overstate the protein your body can use.
What's the difference between added sugar and total sugar?
Total sugars include sugar that is naturally present in milk or fruit plus sugar added during processing. Added sugars count only what the maker adds, such as table sugar, syrups, honey and concentrated juice. The FDA sets a 50 g Daily Value for added sugars and none for total sugars, so the added line is the one to watch.
Are protein snacks good for you?
Some are, but the word protein on the package does not make a snack healthy. Plain Greek yogurt, eggs, edamame and tuna are hard to beat. Packaged snacks vary widely: in our analysis of 2,102 US Open Food Facts records for protein bars, only about 180 (8.5%) deliver 10 g of protein per 100 calories.
Sources
- FDA: How to Understand and Use the Nutrition Facts Label (opens in a new tab)
- FDA: Added Sugars on the Nutrition Facts Label (opens in a new tab)
- FDA: Daily Value on the Nutrition and Supplement Facts Labels (opens in a new tab)
- 21 CFR 101.54: Nutrient content claims for "good source," "high," "more," and "high potency" (opens in a new tab)
- 21 CFR 101.9: Nutrition labeling of food (opens in a new tab) (protein %DV and PDCAAS; sugar alcohol declaration)
- Dietary Guidelines for Americans 2025–2030 (opens in a new tab)
- AAFP summary of the Dietary Guidelines for Americans 2025–2030 (opens in a new tab)
- Cleveland Clinic: How To Choose the Best Health Bars (opens in a new tab)
- Herreman L, et al. Comprehensive overview of the quality of plant- and animal-sourced proteins based on the digestible indispensable amino acid score. Food Science & Nutrition, 2020 (opens in a new tab) (DOI 10.1002/fsn3.1809)
- van den Berg LA, et al. Protein quality of soy and the effect of processing: a quantitative review. Frontiers in Nutrition, 2022 (opens in a new tab)
- Paul C, Leser S, Oesser S. Significant amounts of functional collagen peptides can be incorporated in the diet while maintaining indispensable amino acid balance. Nutrients, 2019 (opens in a new tab)
- USDA FoodData Central (opens in a new tab)
- Open Food Facts (opens in a new tab) US product data, analyzed by our team. Records with more than 90 g protein per 100 g, calories more than 20% off their macros, macros above 105 g per 100 g, or more sugar than carbohydrate are removed. Protein bar figures use our 2,102-record protein bar segment (bars with "protein" in the name or category, or at least 15 g of protein per 100 g); meat-snack figures use 1,026 jerky and meat snack records.
More background reading is on our resources page.