Protein per 100 Calories: The Simplest Way to Compare Snacks
By Editorial Team. Updated . 9 min read.
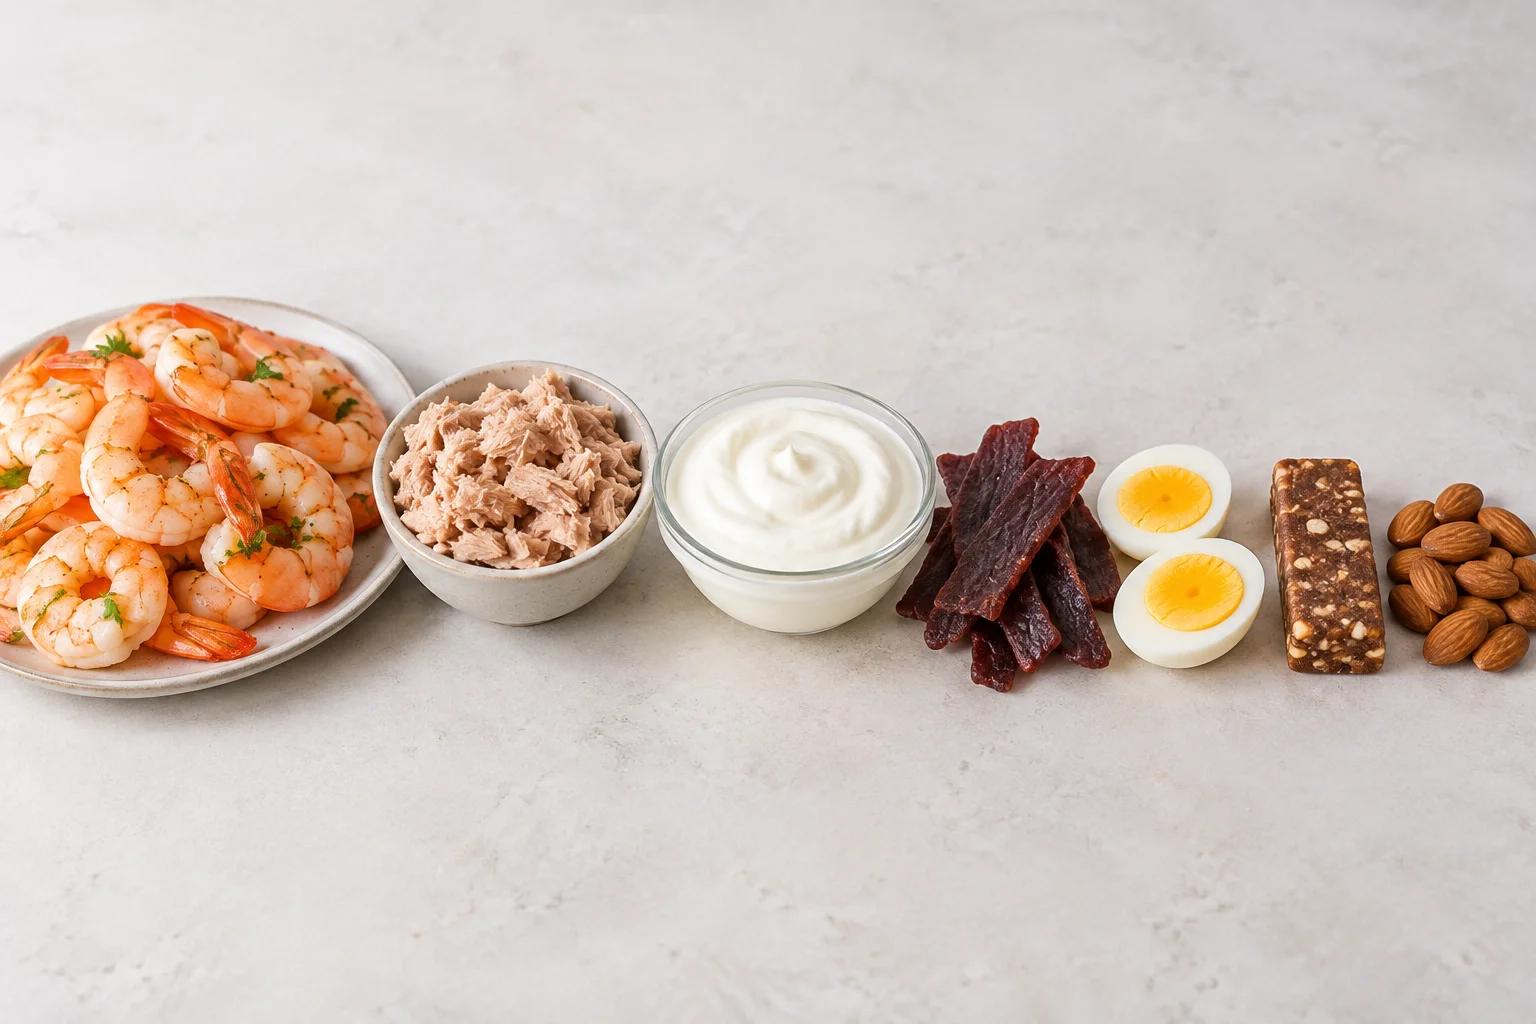
Protein per 100 calories equals grams of protein divided by calories, times 100. It shows how much protein you get for your calorie budget. Ten grams or more is excellent (Greek yogurt, tuna, lean jerky), 5 to 9.9 grams is good, and under 5 grams means the snack is mainly fat or carbs, like most nuts.
Key takeaways
- Formula: protein (g) ÷ calories × 100 = g protein per 100 calories.
- A snack with 10 g or more of protein per 100 calories is considered highly protein-dense.
- Multiply the score by 4 to get the share of calories from protein: a score of 10 means 40%.
- The practical ceiling is about 25, because protein provides about 4 calories per gram.
- In our analysis of 2,102 US Open Food Facts records for protein bars, the median bar scored only 5.9, and just 8.5% reached 10; the median across 677 jerky records scored 12.5.
What is protein per 100 calories?
Protein per 100 calories is a measure of protein density: how much of a food's energy arrives as protein. It turns two numbers from the Nutrition Facts label into one score that works across any food, serving size or brand.
Protein per 100 kcal = (grams of protein ÷ calories) × 100
The score converts directly into a percentage. Protein supplies about 4 calories per gram (the Atwater factor; carbohydrate is also 4 and fat is 9), so score × 4 = percent of calories from protein. A pure-protein food would score 25. Whole foods always carry some fat or carbohydrate, so the best of them land between about 20 and 24.
You will occasionally see an isolate listed slightly above 25. Nutrition Advance's USDA-linked table, for example, puts soy protein isolate at 26.4 (opens in a new tab). That is not a loophole in the math: USDA applies food-specific energy factors (some proteins yield a little under 4 calories per gram), and labels round both numbers. Treat 25 as the working ceiling.
How to calculate it (worked example)
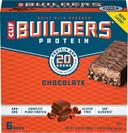
Take a real label from our catalog, the Clif Builders Chocolate bar: 20 g of protein and 280 calories per bar.
- Divide protein by calories: 20 ÷ 280 = 0.071
- Multiply by 100: 7.1 g protein per 100 calories
Now a plain nonfat Greek yogurt: 17 g of protein and 100 calories in 6 ounces.
- 17 ÷ 100 = 0.17
- × 100 = 17 g protein per 100 calories
Both are sold as "high protein," but the yogurt delivers more than twice the protein for each calorie. The serving size cancels out, so the per-100-gram column gives the same answer, as long as protein and calories come from the same column. One caution: US labels round protein to the nearest gram and calories to the nearest 5 or 10, so treat scores within about half a point of each other as a tie.
Protein density tiers
| Tier | Protein per 100 kcal | Share of calories from protein | Examples |
|---|---|---|---|
| Excellent | 10 or more | 40% or more | Tuna, shrimp, egg whites, turkey breast, Greek yogurt, cottage cheese, tofu, lean jerky |
| Good | 5–9.9 | 20–39% | Whole eggs, string cheese, edamame, beef jerky, most good protein bars, pumpkin seeds |
| Low | Under 5 | Under 20% | Almonds, cashews, peanut butter, fruit-and-nut bars, most crackers and chips |
For context, the National Academy of Medicine range cited by Harvard's Nutrition Source (opens in a new tab) is 10% to 35% of daily calories from protein. An "excellent" snack sits above that range on purpose: it is a protein top-up, not a whole diet.
"Low" does not mean unhealthy. Almonds are a nutritious snack; they are a fat snack that happens to contain protein.
The most protein-dense snacks
Whole-food values are calculated from USDA FoodData Central (opens in a new tab) per-100-g data for the food as eaten (cooked, drained or ready to eat), scaled to the serving shown; each row names its FDC ID. Branded values are per-serving label numbers checked in October 2026. Brands reformulate, so check the package.
| Rank | Snack (serving) | Protein (g) | Calories | Protein per 100 kcal |
|---|---|---|---|---|
| 1 | Cooked shrimp (3 oz; FDC 175180) | 20.4 | 84 | 24.2 |
| 2 | Light tuna in water, drained (3 oz; FDC 173709) | 16.5 | 73 | 22.6 |
| 3 | Roasted turkey breast, sliced (2 oz; FDC 174514) | 15.9 | 74 | 21.5 |
| 4 | Egg whites (4 large; FDC 172183) | 14.4 | 69 | 21.0 |
| 5 | Plain nonfat skyr (5.3 oz; FDC 2400949) | 17.0 | 90 | 18.8 |
| 6 | Canned pink salmon, drained (3 oz; FDC 173724) | 20.9 | 116 | 18.1 |
| 7 | Nonfat plain Greek yogurt (6 oz; FDC 170894) | 17.3 | 100 | 17.3 |
| 8 | 1% cottage cheese (½ cup; FDC 173417) | 14.0 | 81 | 17.2 |
| 9 | 2% cottage cheese (½ cup; FDC 172182) | 11.8 | 92 | 12.8 |
| 10 | Extra-firm tofu (3 oz; FDC 174290) | 8.5 | 70 | 12.1 |
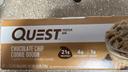
| 11 | Quest Chocolate Chip Cookie Dough (1 bar, 60 g) | 21 | 190 | 11.1 |
| 12 | Shelled edamame (½ cup; FDC 168411) | 9.2 | 94 | 9.8 |
| 13 | Part-skim mozzarella string cheese (1 oz stick; FDC 171244) | 6.7 | 84 | 8.1 |
| 14 | Hard-boiled egg (1 large; FDC 173424) | 6.3 | 78 | 8.1 |
| 15 | Beef jerky (1 oz; FDC 167536) | 9.4 | 116 | 8.1 |
These figures line up with independent USDA-based rankings, such as Nutrition Advance's 24.2 for cooked shrimp and 17.2 for low-fat cottage cheese. Quest also sells a newer 250-calorie, 25 g version of this flavor, so confirm which label you have. For contrast, popular snacks further down:
| Snack (serving) | Protein (g) | Calories | Protein per 100 kcal |
|---|---|---|---|
| Clif Builders Chocolate (1 bar, 68 g) | 20 | 280 | 7.1 |
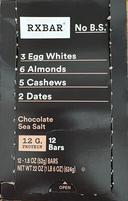
| RXBAR Chocolate Sea Salt (1 bar, 52 g) | 12 | 200 | 6.0 |
| Roasted pumpkin seed kernels (1 oz; FDC 170557) | 8.4 | 163 | 5.2 |
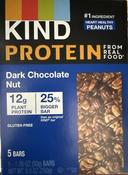
| KIND Protein Dark Chocolate Nut (1 bar, 50 g) | 12 | 240 | 5.0 |
| Dry-roasted peanuts (1 oz; FDC 173806) | 6.9 | 166 | 4.2 |
| Smooth peanut butter (2 tbsp; FDC 172470) | 7.1 | 191 | 3.7 |
| Dry-roasted almonds (1 oz; FDC 170158) | 6.0 | 170 | 3.5 |
| Larabar Cashew Cookie (1 bar, 48 g) | 4 | 230 | 1.7 |
Lean animal foods and soy dominate because almost all their calories come from protein. Add fat (nuts, chocolate coatings) or sugar (dates, syrups) and the score drops, even when the grams on the wrapper look impressive. See how nuts compare in our nuts and seeds category.
What our product data shows by category
Published protein-density tables cover whole foods. We found no authoritative source that reports protein per 100 calories for packaged snacks, so we calculated it ourselves from our analysis of 23,236 cleaned US Open Food Facts records, after removing records with impossible numbers:
| Category (records) | Median protein per 100 kcal | Share scoring 10+ |
|---|---|---|
| Jerky and meat snacks (1,026) | 11.1 | 58.5% |
| Protein bars (2,102) | 5.9 | 8.5% |
| Nuts and seeds (7,742) | 3.1 | under 1% |
| Chips and crackers (4,189) | 2.5 | under 1% |
Meat snacks are the only packaged category where most products are genuinely protein-dense; compare them in jerky and meat snacks. Only about 8.5% of protein bars reach 10, roughly one in 12, and the median bar carries 8 g of sugar per serving. For yogurt, skyr and cheese, see the dairy category.
Why protein density beats "grams of protein" on the label
The front of a package shows grams per serving, and serving size is where the tricks live:
- Big servings inflate grams. A 2-bar pack or a 3-ounce bag of protein chips can claim 20 g while carrying 400+ calories.
- Small servings hide calories. Nut butters and trail mixes use 2-tablespoon or ¼-cup servings few people stick to.
- "High protein" ignores calories. FDA's protein Daily Value is 50 g, and a product can call itself high in protein at 20% of that, 10 g per serving, however many calories come with it. FDA's label guide (opens in a new tab) treats 20% DV or more as "high."
Protein per 100 calories cuts through all three, because serving size drops out of the math. That is why it matters on a calorie budget; see low-calorie high-protein snacks.
It also makes daily targets practical. The International Society of Sports Nutrition's position stand (opens in a new tab) suggests about 20 to 40 g of protein per eating occasion for active people. Getting 20 g from almonds takes over 500 calories; from Greek yogurt, about 120. For how many grams a snack should provide, see how much protein a snack should have.
When protein density isn't the whole story
The ratio is a first filter, not a verdict. It says nothing about:
- Protein quality. Collagen and gelatin count fully toward label grams but lack the amino acid tryptophan, so they are incomplete proteins. Whey, milk, egg, meat, fish and soy are complete.
- Fullness. In a small crossover trial, a 160-calorie high-protein yogurt snack curbed afternoon hunger more than chocolate with the same calories, and people ate about 100 fewer calories at dinner than after crackers (Ortinau et al., 2014 (opens in a new tab)). That was a single-day study in 20 women, and fiber, volume and water also drive fullness, none of which the score captures.
- Total grams. A 40-calorie snack can score 20 and still deliver only 8 g. Check that a snack provides enough protein to matter; Harvard Health (opens in a new tab) suggests at least 5 g.
- Sodium. Jerky scores high, but the median across 1,026 US Open Food Facts meat-snack records carried 400 mg of sodium per serving, and Harvard Health flags jerky sodium too.
- Sugar. The median protein bar in our data (2,102 records) had 8 g of sugar per serving, and many jerkies are cured with sugar.
- Processing. A bar can reach 10 by swapping sugar for sugar alcohols, added fibers and protein isolates. Nearly nine in ten (88%) protein bars with a NOVA rating were ultra-processed (group 4).
Our label checklist for choosing a healthy protein snack shows how we weigh these together.
How we use it to rank snacks
Every product in our directory carries a protein-per-100-calories score, calculated the same way everywhere on the site:
- Formula: label protein (g) ÷ label calories × 100, using the per-serving Nutrition Facts values. Where only per-100-g data exists, we use that column; the ratio is identical.
- Data: packaged products come from Open Food Facts records, checked against the product label; whole foods come from USDA FoodData Central, cited by FDC ID.
- Quality checks: we reject records with impossible numbers: more than 90 g of protein per 100 g, or listed calories more than 20% away from the 4-4-9 estimate (4 × protein + 4 × carbs + 9 × fat, counting fiber at about 2 calories per gram).
- Category statistics above use per-100-g values from 23,236 cleaned US Open Food Facts records, with categories assigned by keyword. Protein bars are bars with "protein" in the name or category, or at least 15 g of protein per 100 g; jerky and meat snacks include meat sticks, dried meats and pork rinds.
The score is the primary sort in our protein-density ranking, with added sugar, fiber, sodium, NOVA group and Nutri-Score shown alongside so the trade-offs stay visible. We do not accept payment for placement.
Frequently asked questions
What food has the most protein per calorie?
Protein isolates, lean seafood, egg whites and skinless poultry breast lead, at roughly 20 to 25 grams of protein per 100 calories. Cooked shrimp, light tuna and unflavored protein isolates sit at the very top. The practical ceiling is about 25, because protein supplies about 4 calories per gram.
What is a good protein-to-calorie ratio for a snack?
Ten grams of protein or more per 100 calories is excellent, meaning at least 40 percent of the snack's calories come from protein. Five to 9.9 grams is good, typical of eggs, cheese, beef jerky and better protein bars. Under 5 grams means the snack is mainly fat or carbohydrate, like most nuts and granola bars.
How do I calculate protein per 100 calories?
Divide grams of protein by calories, then multiply by 100. A 6-ounce container of Greek yogurt with 17 grams of protein and 100 calories scores 17. A bar with 20 grams of protein and 280 calories scores about 7.1. Take both numbers from the same column of the label, per serving or per 100 grams.
Are nuts a good source of protein for the calories?
No. Almonds, cashews and walnuts score about 2 to 4 grams of protein per 100 calories because most of their calories come from fat. Peanuts and pumpkin seeds do slightly better at 4 to 5 grams. Nuts are still healthy, with fiber and unsaturated fats, but they are not protein-dense snacks.
Is protein per 100 calories the only number that matters?
No. It measures protein density but ignores protein quality, fullness, total grams, added sugar and sodium. A collagen bar can score well with incomplete protein, and jerky scores high while carrying a lot of salt. Use the ratio as a first filter, then check sugar, sodium, fiber and the protein source.
Sources
- USDA FoodData Central (opens in a new tab) (whole-food values; FDC ID given in each table row)
- Open Food Facts (opens in a new tab) US product data: our analysis of 23,236 cleaned US Open Food Facts records (2,102 protein bars, 1,026 jerky and meat snacks, 677 jerky); records with impossible numbers removed.
- Harvard T.H. Chan School of Public Health: Protein (The Nutrition Source) (opens in a new tab)
- Nutrition Advance: 27 Low-Calorie, High-Protein Foods (opens in a new tab) (USDA-linked protein per 100 kcal values)
- Ortinau et al. (2014), Nutrition Journal: high-protein vs. high-fat snacks and appetite (opens in a new tab)
- Harvard Health Publishing: High-protein snacks to build muscle and keep hunger at bay (opens in a new tab)
- International Society of Sports Nutrition position stand: protein and exercise (Jäger et al., 2017) (opens in a new tab)
- FDA: Daily Value on the Nutrition and Supplement Facts Labels (opens in a new tab)
- FDA: How to Understand and Use the Nutrition Facts Label (opens in a new tab)
More background reading is on our resources page.